Investment Philosophy
US-Based Mutual Fund Performance, 2001-2020
Avoid the Pitfalls of Market Timing
The market’s pricing power challenges mutual fund managers who attempt to outperform through stock picking or market timing. Evidence shows that over the past 20 years, only 19% of US-based equity mutual funds and 11% of fixed-income funds have both survived and outperformed their benchmarks.

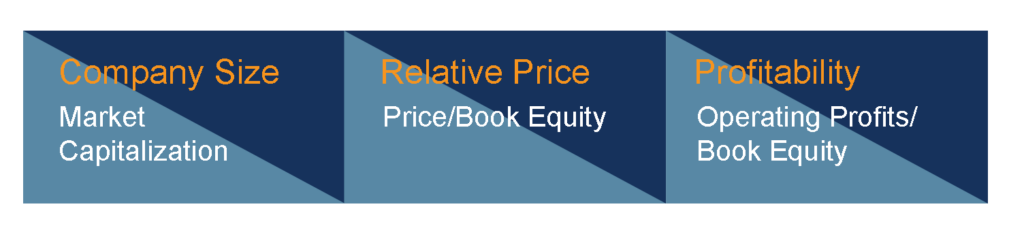
Understanding the Drivers of Investment Returns
Extensive academic research has identified the key drivers of returns. Expected returns are influenced by current market prices and anticipated cash flows. Investors can leverage this information to seek higher expected returns in their portfolios.
EQUITIES
FIXED INCOME

Optimize Your Portfolio with Smart Diversification
Effective risk management often involves holding securities across various market segments, a strategy known as diversification. While diversifying within your domestic market can offer some protection, it may not suffice to fully mitigate risk. Embracing global diversification expands your investment opportunities beyond borders, providing access to diverse economies, industries, and currencies, thereby enhancing the resilience of your portfolio against market fluctuations.
Home Market Index Portfolio
Global Market Index Portfolio

Avoid Market Timing
Market performance can be unpredictable, with different segments experiencing fluctuations from year to year. By maintaining a globally diversified portfolio, investors strategically position themselves to capture returns regardless of where they materialize. This approach enables investors to adapt to changing market conditions and seize opportunities across various regions and sectors, ultimately enhancing the potential for long-term investment success.
Annual Returns by Market Index

Seeking Maximized Returns Through Market Efficiency
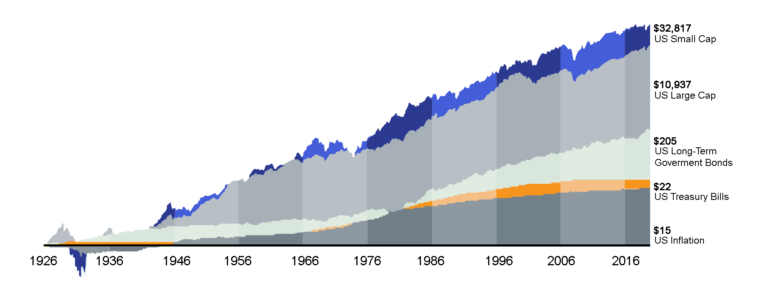
Over time, the financial markets have proven to be rewarding for those with a long-term investment horizon. Investors anticipate a positive return on their capital, and historical data demonstrates that both equity and bond markets have consistently delivered wealth growth that surpasses inflation. This track record highlights the potential for investors to not only preserve their purchasing power but also to generate substantial returns on their investments over the long term.
Growth of a Dollar, 1926-2020 (compounded monthly)
After We Meet, You'll Be Able To
Assess your capacity for investment risk based on your saving and spending plans.
Strike a balance between potential returns and risk to optimize the probability of funding your desired lifestyle.
Gain a clear understanding of your investment portfolio and the strategies needed for success.
Avoid the Pitfalls of Market Timing Exhibit: The sample includes funds at the beginning of the 20-year period ending December 31, 2020. Each fund is evaluated relative to its primary prospectus benchmark. Survivors are funds that had returns for every month in the sample period. Winners are funds that survived and outperformed their benchmark over the period. Where the full series of primary prospectus benchmark returns is unavailable, non-Dimensional funds are instead evaluated relative to their Morningstar category index.
Understanding the Drivers of Investment Returns Exhibit: Relative price is measured by the price-to-book ratio; value stocks are those with lower price-to-book ratios. Profitability is measured as operating income before depreciation and amortization minus interest expense scaled by book.
Optimize Your Portfolio with Smart Diversification Exhibit: Number of holdings and countries for the S&P 500 Index and MSCI ACWI (All Country World Index) Investable Market Index (IMI) as of December 31, 2020. S&P data © 2021 S&P Dow Jones Indices LLC, a division of S&P Global. All rights reserved. MSCI data © MSCI 2021, all rights reserved. International investing involves special risks, such as currency fluctuation and political instability. Investing in emerging markets may accentuate these risks.
Avoid Market Timing Exhibit: In USD. US Large Cap is the S&P 500 Index. US Large Cap Value is the Russell 1000 Value Index. US Small Cap is the Russell 2000 Index. US Small Cap Value is the Russell 2000 Value Index. US Real Estate is the Dow Jones US Select REIT Index. International Large Cap Value is the MSCI World ex USA Value Index (gross dividends). International Small Cap Value is the MSCI World ex USA Small Cap Value Index (gross dividends). Emerging Markets is the MSCI Emerging Markets Index (gross dividends). Five-Year US Government Fixed is the Bloomberg Barclays US TIPS Index 1–5 Years. S&P and Dow Jones data © 2021 S&P Dow Jones Indices LLC, a division of S&P Global. All rights reserved. Frank Russell Company is the source and owner of the trademarks, service marks, and copyrights related to the Russell Indexes. MSCI data © MSCI 2021, all rights reserved. Bloomberg Barclays data provided by Bloomberg. Chart is for illustrative purposes only.”
Seeking Maximized Returns Through Market Efficiency Exhibit: In USD. US Small Cap is the CRSP 6–10 Index. US Large Cap is the S&P 500 Index. US Long-Term Government Bonds is the IA SBBI US LT Govt TR USD. US Treasury Bills is the IA SBBI US 30 Day TBill TR USD. US Inflation is measured as changes in the US Consumer Price Index. CRSP data is provided by the Center for Research in Security Prices, University of Chicago. S&P data © 2021 S&P Dow Jones Indices LLC, a division of S&P Global. All rights reserved. US long-term government bonds and Treasury bills data provided by Ibbotson Associates via Morningstar Direct. US Consumer Price Index data is provided by the US Department of Labor Bureau of Labor Statistics.]