Famous late night comedian John Oliver once paralleled the journey of the successful investor with the story of Charlie and the Chocolate Factory. As the story goes, one by one, all the children, except for Charlie, succumbed to the enticing traps while making their way toward the golden ticket. Ultimately trading away their golden opportunity for something of far less value. Similarly, investors are presented with countless diversions along the path to investment success. Over the last 30 years, the average stock investor lagged the global stock market by approximately 3% annually(1). This phenomenon is commonly referred to as the behavior gap. We’ll review some of the most common and costly investor deviations to help you stay the course by closing the behavior gap.
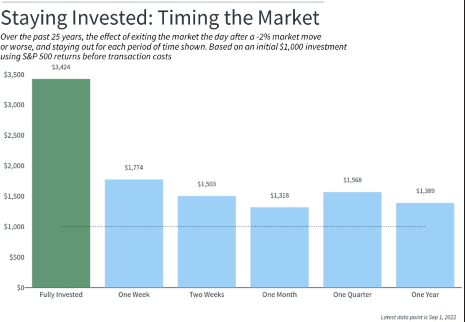
The average investor tends to strongly prefer avoiding losses in comparison to achieving gains. Such that, overwhelmingly, people tend to skew their investment decisions to that end. As the stock market starts to decline many investors rush to sell their investments and hold cash until they believe it is safe to re-enter the market. A few years ago, I remember meeting with a retiree that divulged that he had sold all the investments inside his 401(k) in the wake of the 2008 recession. He was never convinced it was safe enough to repurchase his original investment holdings. So instead, he sat in cash for more than 10 years while US Stocks appreciated more than 300% in value. The graph below further illustrates the risk of sitting on the sidelines after market downturns.
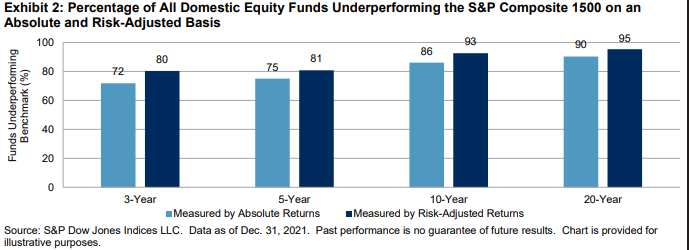
At the end of 2021, in the united states alone, there were more than seven thousand mutual funds (and slightly more ETFs). Each one vying to capture your attention and investment dollars. For every one boring index fund that simply replicates the holdings of a stated index, there were more than 10 actively managed funds with the objective to outperform their benchmark index after fees (2). A few of these funds delivered on that intention. However, your chances of picking a fund that delivered on this over the last 20 years, is less than 5% (3). Meaning as Warren Buffet once stated, “Most investors, both institutional and individual, will find that the best way to own common stocks is through an index fund that charges minimal fees”(4).
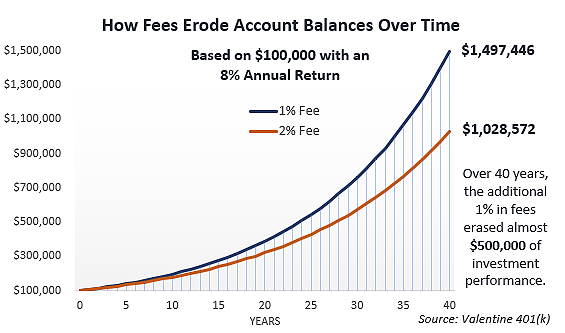
Familiar to most investors is the “miracle” of compound interest, which is, the exponential growth potential that can come through earnings on earnings. Though, far fewer are aware of the forgone compound interest opportunity when investment dollars are used to pay for fees and expenses. This can be staggering (as seen in the chart below). Fortunately, today’s passive index funds can be utilized with minimal costs often ranging from .03% to .2% annually compared with the countless investment options available with fees in excess of even 2% annually. Most investment advisors will ultimately charge somewhere between .50% to 1.25% annually for their services. The key here will be ensuring that the financial, emotional, and time savings benefits provided are greater than the cost. Generally, if you have an advisor that is proactive in the areas of retirement, tax, and risk management planning, there is ample opportunity for the benefits to outweigh the cost. Though, if an annual phone call and a card during the holidays are the only services being rendered, you may want to consider searching for a new advisor.
By staying invested through the troughs and peaks (market highs and lows) of the market, using low-cost index funds, and avoiding unnecessary fees, you will close the behavior gap. Like Charlie, after successfully navigating the various pitfalls along your journey, the golden ticket will be yours in the form of an extra 3% annually. That could easily mean a doubling, or even tripling, of funds available for you and your loved ones to enjoy. Maybe even a chocolate factory…
_______________________________________________________________________________________________________________________________________________________________
References:
- The 2022 QAIB Report by the DALBAR Institute, the average investor is represented by “The Average Equity Fund Investor” in the report and is comprised of a universe of both domestic and world equity mutual funds. It includes growth, sector, alternative strategy, value, blend, emerging markets, global equity, international equity, and regional equity funds.
- Published by Statista Research Department, Jul 4, 2022, https://www.statista.com/statistics/1263885/number-active-passive-mutual-funds-usa/#:~:text=Total%20active%20and%20passive%20mutual%20funds%20in%20the%20U.S.%202000%2D2021&text=In%202021%2C%20there%20were%20a,in%20the%20U.S.%20in%202021
- SPIVA U.S. Scorecard as of 12/31/2021 provided by S&P Down Jones Indices. https://www.spglobal.com/spdji/en/documents/spiva/spiva-us-year-end-2021.pdf
- 1996 Berkshire Hathaway Annual Report